EEBO Metrics create a line of sight from engineering excellence to business outcomes

They are an essential framework for Tech leadership

Benefits

EEBO Metrics act as clear value articulation of the benefit of engineering excellence

EEBO Metrics provide guardrails for long-running programs by acting as fitness metrics

EEBO Metrics give each member clarity on how their work leads to the final benefit

Usage

Use EEBO Metrics to identify derailment of engineering excellence or misalignment to outcomes

Use EEBO Metrics as an information radiator, fostering alignment between team members and business stakeholders

Anti-Patterns

After careful considersation of all 437 charts, graphs, and metrics, I've decided to throw up my hands, hit the liquor store, and get snockered. Who's with me?!'

“Using EEBO Metrics for drilling down into specific scenarios or spotting bottlenecks”

While EEBO Metrics are valuable for assessing overall engineering excellence, they may not be suitable for analyzing specific scenarios or identifying bottlenecks. To gain a comprehensive understanding, it's crucial to complement EEBO Metrics with drill-down metrics and engage in meaningful conversations with developers for a root cause assessment.

“EEBO Metrics keep growing into larger set”

EEBO Metrics should be a small set. Often Metrics keep growing due to fear of missing out (FOMO), pressure to show progress or to accommodate representation of teams, departments or leadership.

This anti-pattern can also be understood as adjacent to Conway’s Law. In 1968, computer programmer Melvin Conway made an observation that has since become known as Conway's Law. It states that "organizations which design systems... are constrained to produce designs which are copies of the communication structures of these organizations." In other words, the way that a company is structured will inevitably shape the way that its products and systems are designed.

Thus metrics keep growing to reflect each layer and slice of the organisation and its line of communication.

Our new dashboard has all of the different kpi's we can track now. what's that kpi trending to zero? it measures how well we understand them all.

Characteristics of a good EEBO Metrics

These characteristics make them less susceptible to gaming or manipulation as they requires alignment and effectiveness across multiple facets of the program

EEBO Metrics tend to be derived or multivariate metrics, which are calculated from multiple data points or measurements

EEBO Metrics also tend to be meta in nature, which means the metrics measure other metrics’ impact on the overall program

EEBO Metrics are easily understood by all in the program, ensuring shared understanding of the fitness & outcome metrics

Emergence of a structure for EEBO Metrics

Need for coverage from software development to deployment-in-production resulting in achieving the business outcomes.

Excellence in Software Development: Passing Tests, Cyclomatic Complexity, Test Coverage, Technical Debt, Defects Count, Velocity, Security Violations, UAT Issues. Excellence in Deployment into Production: Deployment Frequency, MTTR, Change Fail %, Lead Time, Availability, Security Incidents, Production Issues. Progress towards desired business outcomes: Unique visitors per month, Session duration, Infrastructure Spend.

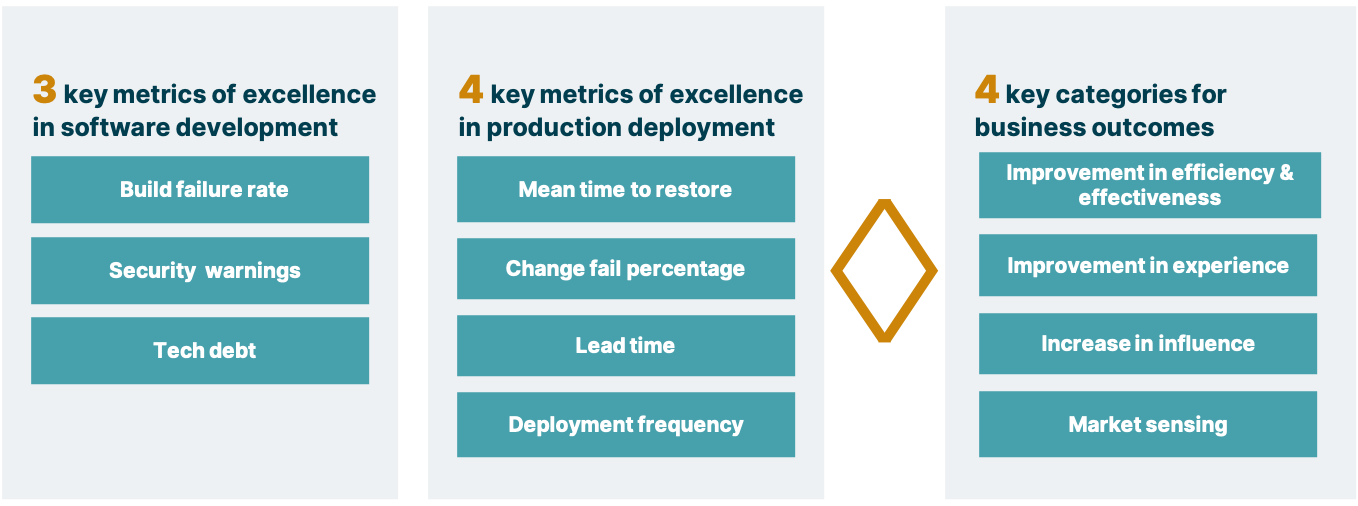
Structure of EEBO Metrics

Metrics reflecting engineering excellence, Metrics reflecting production deployment excellence, Metrics categories reflecting progress towards desired business outcomes

What are the recommended EEBO Metrics?

3 key metrics of engineering excellence: Build failure rate, Security  warnings, Tech debt. 4 key metrics of production deployment excellence: Mean time to restore, Change fail percentage, Lead time, Deployment frequency. 4 key categories for business outcomes: Improvement in efficiency & effectiveness, Improvement in experience, Increase in influence, Future sensing.

Sensible defaults for EEBO Metrics

A baseline for a EEBO Metrics should come from the domain of the product and industry of the organization

EEBO Metrics should make success criteria clear

EEBO metrics should also make the failure threshold clear beyond which either there is a pivot or termination

EEBO metrics should include a remediation plan for correction over knee-jerk when under-performing

Maturity Model

"We need a tool"

Aim is to gather data driven by ‘what we can not measure, we can not improve’. Tools that promise capturing lots of data, allow for slicing and dicing for Root Cause Analysis, usually win. This is a tough level to cross as it involves approvals on budget, ownership within org, InfoSec and compliance aspects

"We need to track this metric"

Aim is to identify that right metric that makes the excellence of team evident. This follows with the identification of that right metric that isolates issues beyond the control of the team.

"We need to tell a cohesive story"

Aim is to identify the storyline that’s emerging from the focused subset of metrics. This follows with establishment of excellence of the team or at least their path towards it.

"We need to relate to business outcomes"

Aim is to establish a correlation between improvement towards excellence and improvement in expected business outcomes. This is a tough level to achieve as it involves ingestion of business data, an activity that may not be easy to automate and compliance ask complicating the data flow.

Podcast

EEBO Podcast - Let's see where it goes - LUSWIG

LUSWIG - Let's See Where It Goes

Join Dinker and Sachin, passionate advocates of EEBO Metrics, as they discuss EEBO Metrics and few other related topics on their Podcast.

EEBO Podcast - Let's see where it goes - LUSWIG

Read More

How do you know engineering is powering business growth?

Read

Dysfunctional metrics kill agile transformations

Read

People

Meet the folks actively working on EEBO Metrics

Dinker Chark

Sachin Dharmapurikar

Vaishnavi Narayanan